New PDPM LTC Trend Tracker Module Can Help with Medicare Compliance
Daniel Ciolek
11/1/2022
In October 2022, AHCA launched a new Patient Driven Payment Model (PDPM) module on the Long Term Care (LTC) TrendTracker (TT) platform that providers can use to monitor their Medicare Part A compliance risk. In this article, we will discuss why skilled nursing facility (SNF) Medicare compliance programs are important, where AHCA members can access the PDPM TT reports, what data are in the reports, and how the reports can be used for facility- or company-wide Medicare compliance programs.
Why Are SNF PPS PDPM Compliance Programs Important?
In October 2019, the Centers for Medicare and Medicaid Services (CMS) switched the SNF prospective payment system (PPS) model from the resource-use-based RUG-IV model to the PDPM, which is primarily based on unique resident characteristics as coded on the Minimum Data Set (MDS) resident assessment instrument.1 In that rule, and in subsequent rulemaking,2,3,4,5 CMS has emphasized that it is closely monitoring SNF payments and any associated changes in MDS coding that could suggest that providers are stinting on therapy services or reducing length of stays, inappropriately using concurrent and group therapies, or upcoding certain MDS items to achieve higher payments. The U.S. Department of Health and Human Services Office of Inspector General is also conducting a study to determine whether Medicare payments to SNFs under PDPM comply with Medicare requirements.6
Per CMS, Medicare contractors conduct medical review to prevent improper payments and protect the Medicare Trust Fund.7 Medical reviews involve the collection and clinical review of medical records and related information to ensure that payment is made only for services that meet all Medicare coverage, coding, billing, and medical necessity requirements. Medicare Fee-for-Service (FFS) reviews are conducted by Medicare Administrative Contractors (MACs), the Supplemental Medical Review Contractor (SMRC), Recovery Audit Contractors (RACs), and others.
These activities are based on data analysis and other findings indicative of a potential vulnerability, and programs, such as Targeted Probe and Educate, focus on providers with outlier data patterns that could suggest improper billing.8 Providers that have timely access to data that indicate their risk for audit can use this information in compliance programs to identify any potential issues and implement corrective measures to either reduce the risk of audit or to be best prepared to respond to an audit.
What Specific PDPM Information Is Now Available in TT?
The AHCA PDPM TT reports contain facility-specific trends for 37 key metrics being evaluated by CMS and medical review contractors to target for potential payment errors. The reports, derived from MDS data, allow providers to compare and benchmark metrics on a quarterly basis against peers within their organization, state, or nationwide. The data go back to the onset of PDPM in October 2019, and reports can be generated in both table and trend chart formats. 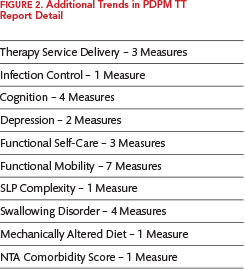
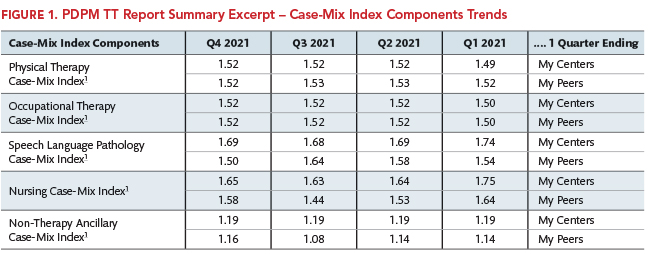
The PDPM TT Report Summary contains 10 high-level aggregate trends: Average Medicare Rate PPD (per patient day); the average CMI (case-mix index) value for each of the five PDPM case-mix adjusted components (physical therapy = PT, occupational therapy = OT, speech-language pathology = SLP, nursing, and non-therapy ancillary = NTA); the average Medicare length of stay; and the average PT, OT, and SLP minutes per stay. Figure 1 provides an excerpt of the PDPM Case-Mix Index Components portion of an example facility for the most currently available four quarters of MDS data as compared to the selected peer group. Footnotes are included as appropriate to provide additional detail about the data and/or provider audit risk.
If the facility’s results are higher or lower than their peers for these factors, and if the footnotes indicate a potential audit risk, then exploration of the additional 27 trends listed in the Report Detail may be useful in tracking down the MDS data elements that are driving the differences. Figure 2 summarizes the additional types of trend data available in the Report Detail.
The Report Detail screen also allows providers to obtain graphic drill-down of the measures with a longer look-back period. As demonstrated in Figure 3, the SLP CMI trends listed in Figure 1 are displayed in a bar chart comparing the facility’s quarterly average SLP CMI trends to the peer group for the most recent three years of available data.
Using PDPM TT Reports for Compliance Efforts
Having different average payment or MDS coding patterns from other providers doesn’t necessarily mean a provider is doing anything wrong, especially if the provider is treating a different patient population and is getting good quality outcomes. However, as discussed above, having different rates than peers for certain metrics being evaluated by claim auditors may increase a provider’s risk for audit and payment denial if the MDS coding is not supported by the clinical documentation.
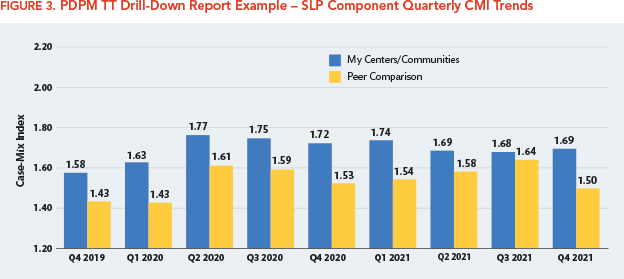
For example, as shown in Figure 1, the facility had a higher SLP component average CMI than its peers, so looking at the PDPM TT Report Detail for the trends for various MDS items that impact the SLP component rates, such as cognition, SLP complexity, swallowing disorders, and mechanically altered diet, may be helpful in identifying the clinical characteristics driving the higher CMI value. Additionally, the TT drill-down report shown in Figure 3 can show if the difference from peers is a recent event or longstanding trend.
Once a provider has identified the specific underlying MDS data items driving the differences, it will make it easier to focus internal chart audits to validate the accuracy of the coding and/or the completeness of the documentation supporting the coding. The results could then confirm whether the MDS coding is supported and defensible upon any future audit, or whether staff education efforts are necessary to assure the documentation and coding are appropriate.
References
- 1 FY 2019 SNF PPS Final Rule 83 FR 39162, August 8, 2018 (https://www.federalregister.gov/documents/2018/08/08/2018-16570/medicare-program-prospective-payment-system-and-consolidated-billing-for-skilled-nursing-facilities)
- 2 FY 2020 SNF PPS Final Rule 84 FR 38728, August 7, 2019 (https://www.federalregister.gov/documents/2019/08/07/2019-16485/medicare-program-prospective-payment-system-and-consolidated-billing-for-skilled-nursing-facilities)
- 3 FY 2021 SNF PPS Final Rule 85 FR 47594, August 5, 2020 (https://www.federalregister.gov/documents/2020/08/05/2020-16900/medicare-program-prospective-payment-system-and-consolidated-billing-for-skilled-nursing-facilities)
- 4 FY 2022 SNF PPS Final Rule 86 FR 42424, August 4, 2021 (https://www.federalregister.gov/documents/2021/08/04/2021-16309/medicare-program-prospective-payment-system-and-consolidated-billing-for-skilled-nursing-facilities)
- 5 FY 2023 SNF PPS Final Rule 87 FR 47502, August 3, 2022 (https://www.federalregister.gov/documents/2022/08/03/2022-16457/medicare-program-prospective-payment-system-and-consolidated-billing-for-skilled-nursing-facilities)
- 6 OIG Work Plan: Skilled Nursing Facility Reimbursement webpage (https://oig.hhs.gov/reports-and-publications/workplan/summary/wp-summary-0000575.asp)
- 7 CMS Medical Review and Education webpage (https://www.cms.gov/research-statistics-data-and-systems/monitoring-programs/medicare-ffs-compliance-programs/medical-review)
- 8 CMS Targeted Probe and Educate webpage (https://www.cms.gov/research-statistics-data-and-systems/monitoring-programs/medicare-ffs-compliance-programs/medical-review/targeted-probe-and-educatetpe)
Daniel Ciolek is associate vice president, therapy advocacy, for the American Health Care Association.