The data source for quality measures is the MDS 3.0. Values for three of the QMs (catheter, long-stay pain measure, and short-stay pressure ulcers) are risk adjusted, using covariates. They adjust for individual resident characteristics or health conditions that are essentially out of the facility’s control that may contribute to worse outcomes for a particular QM.
The residents with those conditions are not excluded and are considered to level the playing field when a facility has more residents with the covariate conditions than other facilities.
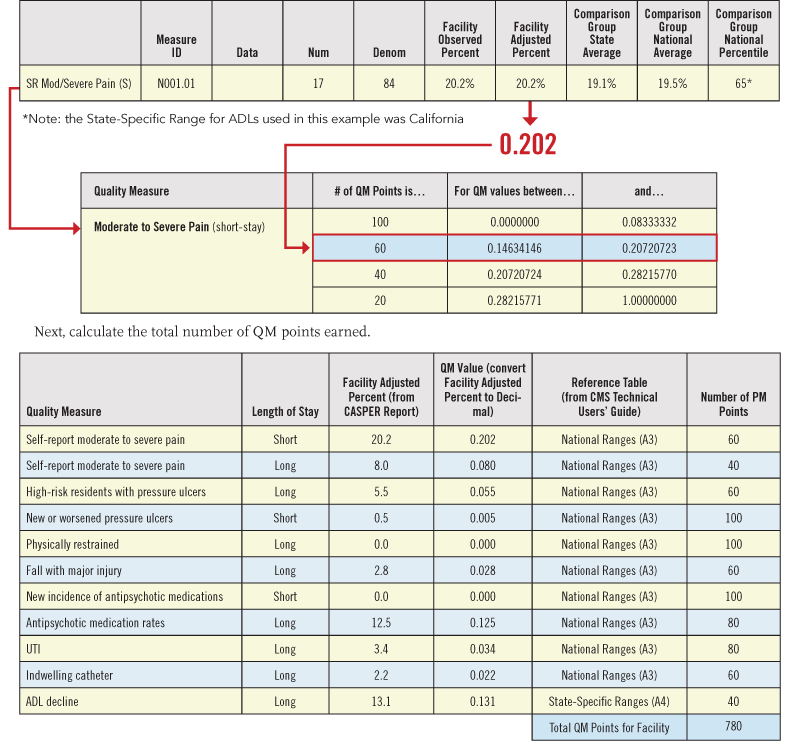
Points earned are based on a facility’s adjusted percent (
see graphic below). This is the value that accounts for the three QMs with covariates and can be obtained either from the CASPER reports or the Five-Star Preview report.

Utilizing the CASPER system as well as other system data points like the Five-Star Preview report helps to benchmark improvement processes. Keep in mind, the CASPER system is updated weekly while the Nursing Home Compare system is updated quarterly. If the CASPER system is used, the set data points must reflect three quarters’ worth of data.
The CMS national and state-specific Ranges for Point Values are listed in decimal values, so it is necessary to convert the percentages to decimals, allowing the ability to compare the data. Begin by locating the Facility Adjusted Percent for the QM on the chosen report.
Next, convert the Facility Adjusted Percent to a decimal by moving the decimal point two places to the left or dividing the percentage by 100, reaching a value of 0.202 in the example on page 30. Follow these same steps for all 11 QMs. Then, compare the Facility Adjusted Percent decimal to the Ranges for Point Values tables in the CMS Technical Users’ Guide. Table A3 (CMS, 2015) represents the National Ranges for the QMs excluding the ADL QM. It is represented in table A4 (CMS, 2015) with the state-specific ranges.
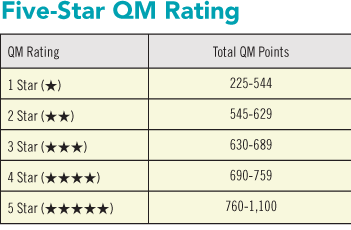
Finally, determine the Five-Star rating (
at right).

Now, managing only by the numbers is not a good practice. Instead, the process of analyzing the data in a proactive way allows facilities to foreshadow potential negative outcomes and focus on fixing problems at the resident level.
The numbers don’t matter if clinical systems failure is the root cause of negative outcomes. Healthy, positive outcomes must reflect the quality of care driven for every resident. A solid QAPI process allowing root-cause analysis of outcomes will present a clear picture of progress, ultimately leading to facility success.