There continued to be much discussion last year about uncertainty within the skilled nursing sector as the business model continued to transition from a fee-for-service business model to a value-based model. Uncertainty is likely to persist through 2017 with a new administration to embrace. Although no one can say for sure what the future holds, it is always a good idea to know where the profession stands in the present.
The following will take a look at the most recent occupancy, revenue, and sales transactions data. The sales transactions data will include some data on both skilled nursing (nursing care) and seniors housing (assisted living, independent living, and memory care).
2016 Transactions: Volume Down but Deal Flow Strong
Last year marked a significant change in the property sales transactions market for seniors housing and care. Over the past few years, public buyers, dominated by public real estate investment trusts (REITs), have been the main players in driving large transaction volume. However, as the cost of capital challenged public REITs in 2016, the institutional and private buyers (including private REITs and partnerships) together accounted for the majority of dollar volume.
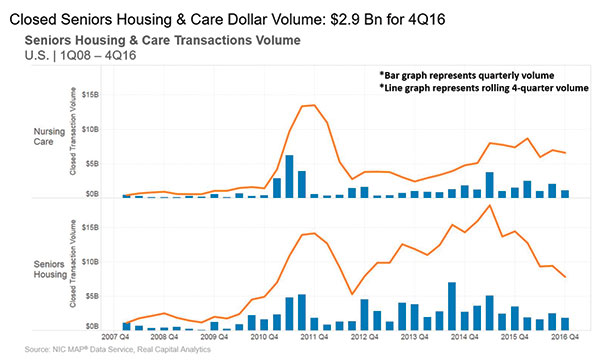
Although the institutional and private buyers stayed active, they were not able to make up for the dollar volume typically produced by public REIT transactions. In turn, volume dropped significantly from 2015. The number of transactions closed was still strong, but the deals were smaller in 2016.
Dollar Volume Trending Down
Transaction volume for seniors housing and nursing care in 2016 registered $14.4 billion, with $7.8 billion in seniors housing and $6.6 billion in nursing care. Total annual volume was down 34 percent from 2015’s $21.8 billion and down 25 percent from 2014, when volume totaled $19 billion.
Last year started out as a tumultuous year in the capital markets. Usually, the first quarter of a year starts off slow given the rush to close deals at the end of the previous year, which effectively empties the pipeline of deals. Then volume picks back up in the second quarter.
In 2016, however, the significant increase in cost of capital most likely delayed the finalization of some deals, and a strong bounce back for deal volume in the second quarter failed to materialize like it had in the past couple of years. Only $2.6 billion closed in the second quarter of 2016 after a relatively strong first quarter of $4.3 billion.
Digging deeper to look at seniors housing and nursing care separately, the decrease in volume from year to year was really driven by seniors housing volume, as volume decreased significantly by 46 percent, from $14.4 billion in 2015 to only $7.8 billion in 2016. Nursing care volume was down but not as much: Its volume decreased by 11 percent in 2016, from $7.4 billion in 2015.
Although dollar volume dropped significantly, the number of transactions was still relatively strong in 2016, as 513 deals closed in 2016. Transaction deal count was down 9 percent from 2015, when 563 deals closed—a record high for this database, which dates back to 2008. In further comparison, 414 transactions closed in 2013 and 556 in 2014.
Costs of Capital Higher for Public REITs
One primary reason for the decrease in public buyer volume was the changing cost of the capital landscape. The Green Street Advisors graph above shows the premium at which public REIT stocks were trading relative to their gross asset value, which is based on the private market capitalization rates and the REITs’ portfolio holdings.
When REITs trade at a premium-to-asset value, they can buy properties by raising equity and debt and will get an instant increase in value because the private market value is lower than their publicly traded equity value. In other words, their cost of capital is low when the premiums are high, and they can make an arbitrage play when these stocks are trading at high premiums.
Starting in 2013, the premiums started to trend down, which in turn effectively raised the REITs’ costs of capital, making it harder to pay up for properties. The premiums fell again in 2015, which was reflected in transaction volume, as activity by public REITs started to decrease dramatically after the second quarter of 2015 and continuing through 2016.
The premiums dropped at the start of 2016 but bounced back rather quickly; however, the premiums were certainly not anywhere as close to where they had been in 2013 and 2014.
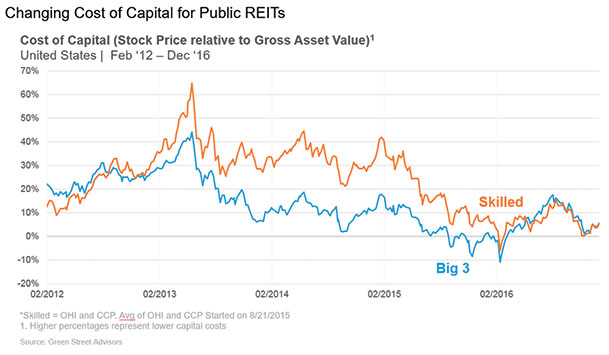
Considering this cost-of-capital trend for the public REITs will most likely continue if interest rates rise (both short-term and longer-term rates), it will be tough for other capital players to make up the difference in terms of dollar volume.
However, smaller owner/operators looking to grow, the private and institutional buyers, and possibly international buyers, will continue to play a role in the number of transactions, barring any major capital market headwinds.
Skilled Nursing Price Per Bed Up 25 percent in 2016
The pricing for nursing care in 2016 saw significant increases in the price per bed. The price for nursing care ended at $95,200 for 2016, which is up 25 percent from last year’s $76,300. Several high-priced transactions that closed in 2016 contributed to the increase, including the Welltower sale to a Chinese life insurance company and its investment manager, Cindat. The 28 nursing care properties in that transaction traded north of the $200,000 price-per-bed mark. In addition, there have been numerous smaller transactions and one-off transactions trading over $100,000.
There are several reasons for the higher prices for skilled nursing beds. First, interest rates remain relatively low, especially in developed markets around the world. In addition, there have been some acquisitions in which the buyers increase the acuity level of patients, which in turn can provide higher cash flow per bed.
Some of these properties have been built out as high-end transitional care businesses, as well. Other buyers are bidding up the price of properties in hopes to increase the Medicare census, which in turn can increase the cash flow at the property.
Seniors housing price per unit ended 2016 at $170,600. It has oscillated around $170,000 to $180,000 for the past couple of years. As volume has decreased, the bid for properties has remained relatively strong, but decreased from the peak of $181,700 in the second quarter of 2015, and has decreased in the latest year-over-year comparison.
On a year-over-year comparison, seniors housing price per unit dropped 4 percent, from $178,500, and 3 percent from the previous quarter. However, it has increased over 200 percent from its cyclical low of $58,500 in 2010.
Occupancy Continues to Trend Down in 2016
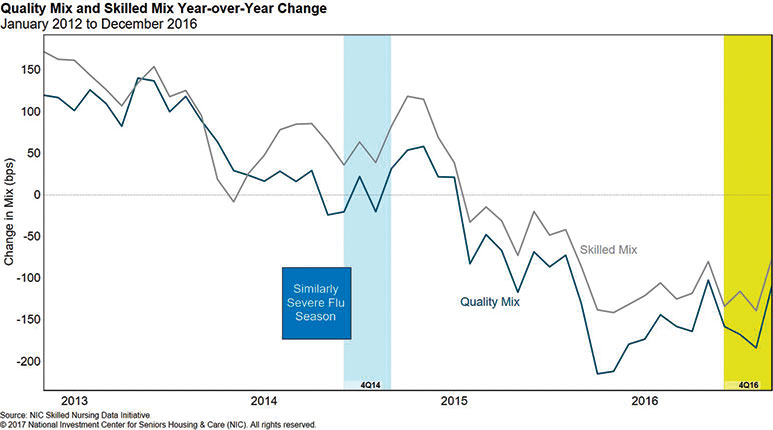
Occupancy fell to 81.8 percent in fourth quarter (4Q) 2016, a new low over the past five years, marking the third consecutive quarter in which occupancy reached its lowest point in the series. Unlike in recent quarters, the decline in occupancy was not driven by declines in quality and skilled mix, which both saw modest increases in 4Q 2016.
Occupancy was down over 150 basis points year-over-year from 83.3 percent, which was the largest year-over-year decline for the fourth quarter in the data series. It is worth noting that the profession has seen accelerated pressure over the past couple of years as the transition has taken hold within 2015 and 2016.
When looking at occupancy, be careful about drawing a complete conclusion as far as the total economics of the business. Occupancy historically has been an important metric to follow, and it still is, but understanding the relationship between occupancy and the true economics of the operating business is just as important.
For example, with some operators transitioning into higher-acuity patient care, it is possible that an operating business captures lower patient days because of the lower length of stay for a greater number of Medicare rehab patients. That will cause occupancy to decline.
However, it is also possible, all else being equal, the higher reimbursement rates for higher-acuity patients will mitigate some of the pressure on cash flow from lower occupancy, as long as the volume of patient admissions is strong and expenses (such as labor expenses) do not increase more than the incremental revenue. In stating that, the continued pressure on occupancy in 2016 does seem significant for the operating businesses.
Skilled Mix Holds Steady
Skilled mix held steady in the fourth quarter of 2016, which could have been in part due to an early and significant flu season (see chart below). However, it fell by 0.8 percent year-over-year to 24.3 percent, which was only slightly higher than the lowest point in the series, reached in September 2012. The rate of year-over-year change in both skilled and quality mix has been negative since 2Q 2015, with the skilled mix decline slightly greater than the quality mix decline.
The skilled mix decline has been driven by pressure on Medicare mix, which reached its lowest level in the data series in 4Q 2016.
The Importance of Medicaid
These days with all of the conversation surrounding value-based purchasing on the Medicare side of the business, it might seem strange to discuss the importance of Medicaid. However, with at least 50 percent of most operator’s revenue coming from Medicaid, it is not only important but vital to survival, especially with the pressure on skilled mix.
Although Medicaid reimburses at a lower rate than Medicare or managed Medicare, it still represents a relatively reliable revenue stream for operators.
Taking it a bit further, just think about the next couple decades when the long-term-stay Medicaid population/demand increases significantly. If not making the national headlines now, it most likely will at some point.
The latest data show Medicaid representing 66.2 percent of patient days as it continues to supply a steady stream of patients. Year-over-year, Medicaid patient-day mix grew 1.3 percent, from 64.9 percent in 2015. Furthermore, Medicaid patient-day mix also grew 3.6 percent over the data time series since 2012.
In addition, the 4Q 2016 data demonstrated the constant increase of Medicaid revenue per patient day (RPPD) as the rate rose to more than $200 for the first time in the five-year series. Medicaid RPPD was up 0.9 percent quarter-over-quarter, and 1.8 percent year-over-year. Over this five-year series, Medicaid RPPD experienced a 1.4 percent compound annual growth rate.
Managed Medicare Revenue Per Patient Day
Managed Medicare has grown in importance, as about one-third of Medicare beneficiaries are enrolled in managed care today. And with the narrowing of networks, coupled with the pricing power these plans possess, it has brought some challenges on the revenue side to operators. However, recent data show that revenue per patient day is showing signs of stabilizing.
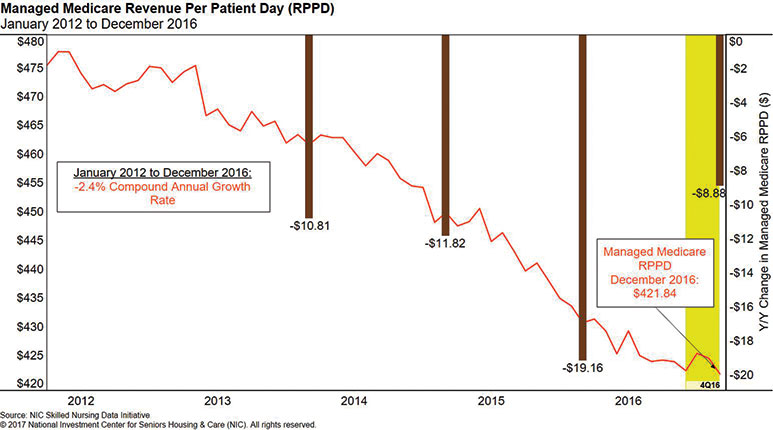
The decrease in managed Medicare RPPD was under $9, year-over-year, compared with a $19 decrease between 4Q 2014 and 4Q 2015. While revenue per patient day for managed Medicare reached its lowest point in the data set at $421.84 in 4Q 2016, the 2.1 percent decrease over 2016 was considerably less than the prior year’s 4.3 percent decline.
The decline quarter-over-quarter was also notably less than in previous quarters, at 0.1 percent, which was the smallest decrease in the past six quarters, portending that the year-over-year decreases may continue to shrink as time progresses.
Managed Medicare will become an even more pressing topic as nearly half of all seniors are expected to be enrolled in managed care over the next 10 years. This data trend certainly warrants attention.
NIC released its latest Skilled Nursing Data Report on March 15, 2017. This latest report and future reports can be downloaded at: http://info.nic.org/skilled_data_report_pr.
Bill Kauffman V, CFA, is senior principal at the National Investment Center for Seniors Housing and Care. He can be reached at bkauffman@NIC.org or (443) 837-2429.