Using Data to Improve Hand Hygiene
Observing staff perform their caregiving duties gives managers the opportunity to gauge handwashing compliance.
Alexis Roam, RN-BC
8/1/2020
During a recent call with nursing facilities, the Centers for Medicare & Medicaid Services’ (CMS) Northeast Division director for survey and reinforcement named three areas of infection control and prevention that surveyors have observed need improvement. Hand hygiene (HH) was at the top of the list.
Hearing this likely caused frustration for providers, as achieving competency—or possessing the ability to perform the skill of HH—is straightforward. However, competence does not necessarily translate into compliance: performing the skill competently and at the appropriate time. Providers charged with improving compliance cannot improve something unless they can measure it. This is when process surveillance data become relevant.
Measuring HH Process Surveillance
Process surveillance involves conducting observations of health care workers (HCWs) engaged in caregiving and noting if they are providing care in a manner that is consistent with current standards. Using HH as the example, the infection preventionist (IP) can take the following three steps to observe and measure compliance:
Step 1: Perform at least 30 unannounced observations of HCWs who interact with residents and perform care. Include a variety of residents, care procedures, shifts, and days of the week in the observations.
Step 2: During each observation, note opportunities to perform HH. Keep track of each opportunity taken in which HH was performed, as well as each missed opportunity. It is important to make sure these two categories are noted separately during observations. When calculating compliance rate, the times HH was performed will be the numerator used, and the total opportunities (both performed and missed) will be the denominator.
Times for Observation
It may also be useful to track observations by HCW category; that is, nurse, certified nurse assistant (CNA), and nonclinical health care worker, so that interventions can be customized to meet the unique needs of that group. Opportunities to perform HH include:
- Immediately before and after touching a resident or the resident’s immediate environment;
- Before donning gloves and performing an aseptic technique, such as placing an indwelling catheter;
- Before moving from work on a soiled body site to a clean body site;
- After contact with blood, body fluids, or contaminated surfaces; and
- Immediately after removal of gloves.
Note: nursing facilities reporting to the Centers for Disease Control and Prevention’s (CDC’s) National Healthcare Safety Network (NHSN) Prevention Process Measures module, which is optional and separate from the required reporting to the Long-term Care Facilities (LTCF) COVID-19 module, will use a different definition.
When reporting for this module, CDC’s NHSN “Prevention Process Measures Surveillance Protocol for Long-term Care Facilities” describes HH opportunities as: “While there are multiple opportunities for proper HH during resident care, the focus of this option is to observe and report HH adherence only after contact with a resident or the objects/surfaces in the immediate vicinity of the resident,” page 2.
Step 3: Calculate the compliance rate each month.
- Numerator = Times HH was performed
- Denominator = Total number of opportunities to perform HH
- Compliance rate = Numerator divided by the denominator, then multiplied by 100
Example:
- Numerator = 42 HH instances observed
- Denominator = 68 opportunities for HH
- 42/68 = 0.617 × 100 = 62%
Translating Data Into Usable Information
Process surveillance data become valuable when they are translated into information that the IP and others can use to evaluate trends in performance. These data may also indicate that further root cause analysis (RCA) is necessary to determine the barriers preventing the achievement of the goals for performance.
The following data management techniques enhance understanding of HH compliance and can guide the IP in translating the process surveillance data into actionable information.
- Establish and use a baseline. A baseline uses existing data to determine a starting point. With that, the IP can establish realistic improvement targets and evaluate improvements or declines in performance over time.
- Avoid analyzing isolated data sets without context. Do not look at one month of data without also analyzing data over several months. This will help the IP understand if performance is truly improving, declining, or sustaining, because context enables meaningful comparisons.
- Establish goals and thresholds. A threshold is an acceptable level of performance. A goal is a level of performance that is desired or intended to be achieved. Sustainable improvement can take significant time to achieve, so take achievability into account when setting goals and thresholds, and be realistic.
- Benchmark performance. A benchmark serves as the standard against which the IP can measure the facility’s performance. Before selecting data to use as a benchmark, leaders should be cautious and analyze it to determine if performance is sub-par in comparison to the expected standard.
- Replace a biased viewpoint in which one justifies the data. Instead, ask questions that break down and investigate what the data may indicate. This is part of a RCA.
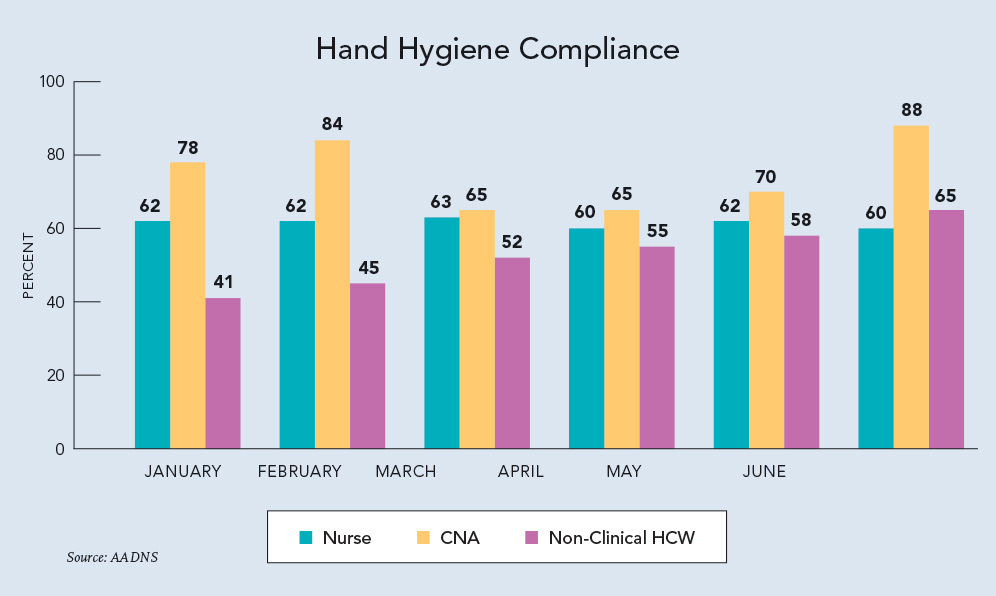 Pour data into a Hand Hygiene Compliance graph (example left). Using data from the graph, the IP can deduce that:
1. There is a significant difference in HH compliance rates among the three types of HCW observed. Why is this?
2. Although the rate of HH compliance for nonclinical HCWs is below that of the CNAs, the trend for improvement is steady. What process changes are contributing to this, and can these processes be replicated and deployed for other categories of HCW?
3. Compliance rates dropped for CNAs in March and April. Turnover rates for CNAs were higher than usual for those months as well (not depicted in the graph). If the root cause for HH is related to the higher turnover rate, what process changes can be made to prevent drastic drops in HH compliance when turnover occurs?
4. The rate of HH compliance for nurses is stagnant, and below that of CNAs. Why is this? Is there a difference in HH compliance among the shifts that can be attributed to workload and care tasks? What reasons do nurses share for the lower HH compliance rate?
Providing Feedback
As the saying goes, “What gets measured gets managed.” HH compliance is no different from many other clinical areas in that what receives attention is usually what improves. Sustaining improvement requires both processes that support adherence and ongoing diligence from leadership to communicate that it remains a priority.
The IP should develop a plan to measure HH compliance regularly and provide feedback to staff. A simple visual such as the graph in this article gives staff an easy way to digest their performance. Adding a goal for performance would provide further value so that staff know very quickly if they are achieving the expectation. To reinforce the importance or the why behind HH compliance, pair it with data showing a decline in infection rates that tracks with increases in HH compliance.
The infection control and prevention program should include HH compliance as one of its measures of performance. These data are shared with the Quality Assurance and Performance Improvement (QAPI) committee so that it can evaluate the program’s performance and work in collaboration with the IP to identify opportunities for improvement.
While HH compliance is not easy to achieve or sustain, a methodical, data-driven approach that includes the use of process surveillance data ensures safer care and better outcomes for the residents in nursing facilities.
Alexis Roam, MSN, RN-BC, DNS-CT, QCP, is curriculum development specialist for the American Association of Directors of Nursing Services (AADNS). She can be reached at aroam@AAPACN.org.