 When the Bipartisan Budget Act of 20181 was enacted, eliminating annual benefit limitations for Medicare Part B (Part B) physical therapy (PT), occupational therapy (OT), and speech-language pathology (SLP) services, Congress also added new provisions to implement a 15 percent payment reduction for services furnished wholly or in part by a physical therapist assistant (PTA) or an occupational therapy assistant (OTA). The PTA/OTA adjustment policy became effective in 2022.2
This was implemented without any knowledge about how PTAs and OTAs are utilized in rural or medically underserved areas, as the Centers for Medicare & Medicaid Services (CMS) did not begin collecting claims data on services furnished under the supervision of the PT or OT billing the services until 2020. This article will summarize key findings about the utilization of PTA/OTA services by skilled nursing facility (SNF) providers in 2021 in an analysis3 performed by Dobson DaVanzo & Associates and commissioned by a coalition of advocacy groups, including American Health Care Association/National Center for Assisted Living (AHCA/NCAL).4
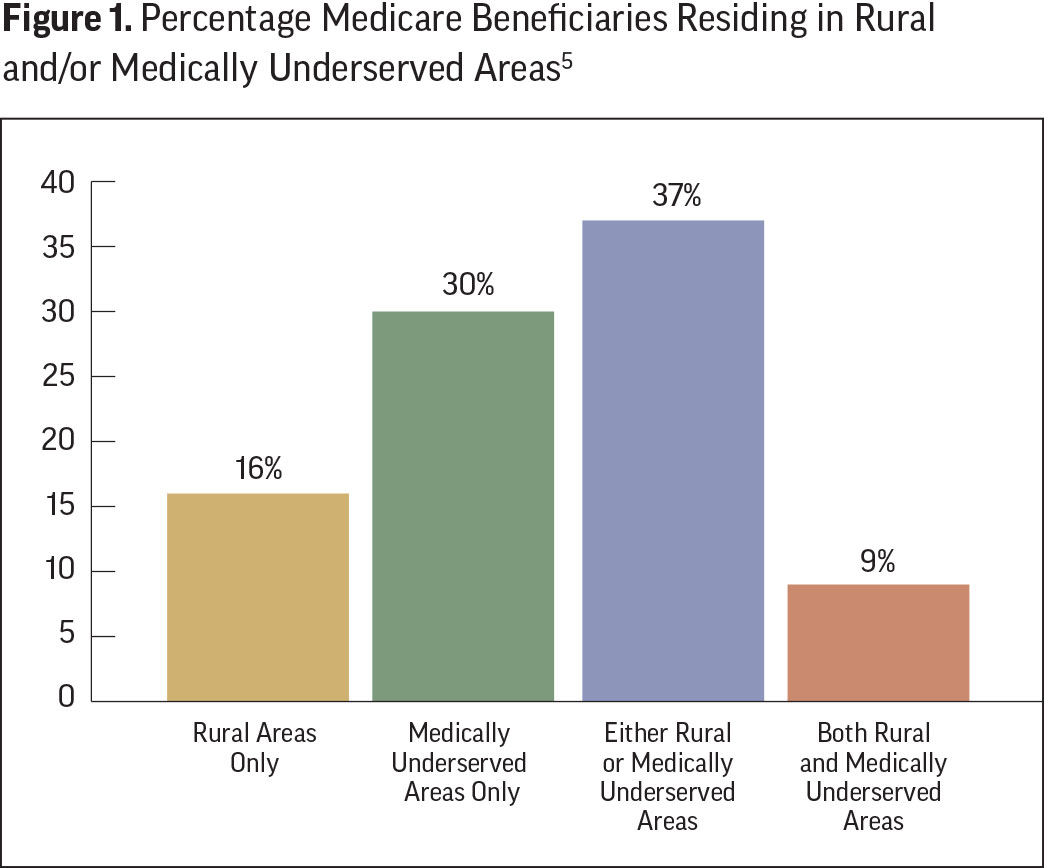
Percentage of Medicare Beneficiaries Residing in Rural and/or Medically Underserved Areas
In 2021 there were nearly 67 million Medicare beneficiaries. As Figure 1 depicts, of these, 37 percent resided in either rural or medically underserved areas. Twenty states or United States territories had over 50 percent of beneficiaries in these locations. Montana and Puerto Rico have the highest portion at 93 percent, while only 13 percent of New Jersey residents live in such disadvantaged locations.
Medicare Part B Therapy Utilization in 2021—All Geographic Areas
As depicted in Table 1, total Medicare Part B payments for all Part B PT, OT, and SLP services in 2021 for 228 million services totaled $7.8 billion. Of this, SNF providers furnished 68 million services totaling $2.5 billion, or 32.5 percent of all therapy services. Specifically of all Part B therapy services, SNFs represented 70.9 percent of SLP,20.6 percent of PT, and 61.1 percent of OT payments.
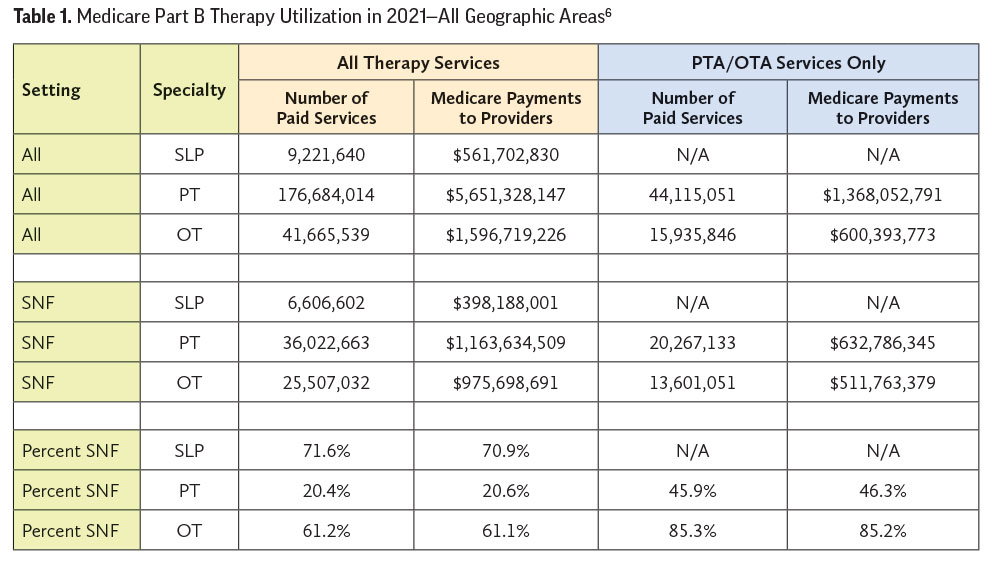
With regard to PTA and OTA services:
- SNF services furnished by PTAs represented 54.4 percent of PT payments within SNFs settings, and 46.3 percent of PTA payments across all settings.
- SNF OTA services represented 52.5 percent of OT payments within SNF settings, and 85.2 percent of OTA payments across all settings.
- Medicare does not recognize SLP assistants; therefore, 100 percent of such services furnished in all settings are provided by a speech-language pathologist.
What is clear from these national utilization numbers is that PT and OT services are furnished, entirely or in part, by a PTA or an OTA in SNF providers at a disproportionately higher percentage than in other settings. As a result, the impacts of the 15 percent PTA/OTA Part B payment reductions have a disproportionate impact on SNF providers nationwide.
Medicare Part B Therapy Assistant Utilization in 2021—Rural or Medically Underserved Areas
Looking more closely at the differences in PTA/OTA utilization between SNF and other Part B therapy provider settings, we compared SNF and non-SNF payments in 2021 for services furnished entirely or in part by a PTA or OTA. We also paid particular attention to differences between therapy assistant use in rural or medically underserved communities and urban communities with adequate health care access.
In the left side of Figure 2, a relatively small percentage of PT Part B services in non-SNF settings are furnished by PTAs, with a nominal difference between urban and rural/underserved areas (21 percent and 21.8 percent, respectively). Non-SNF OTA use in urban areas (33.6 percent), although in the minority of all OT services furnished, was nearly double that of rural/underserved (17.1 percent).
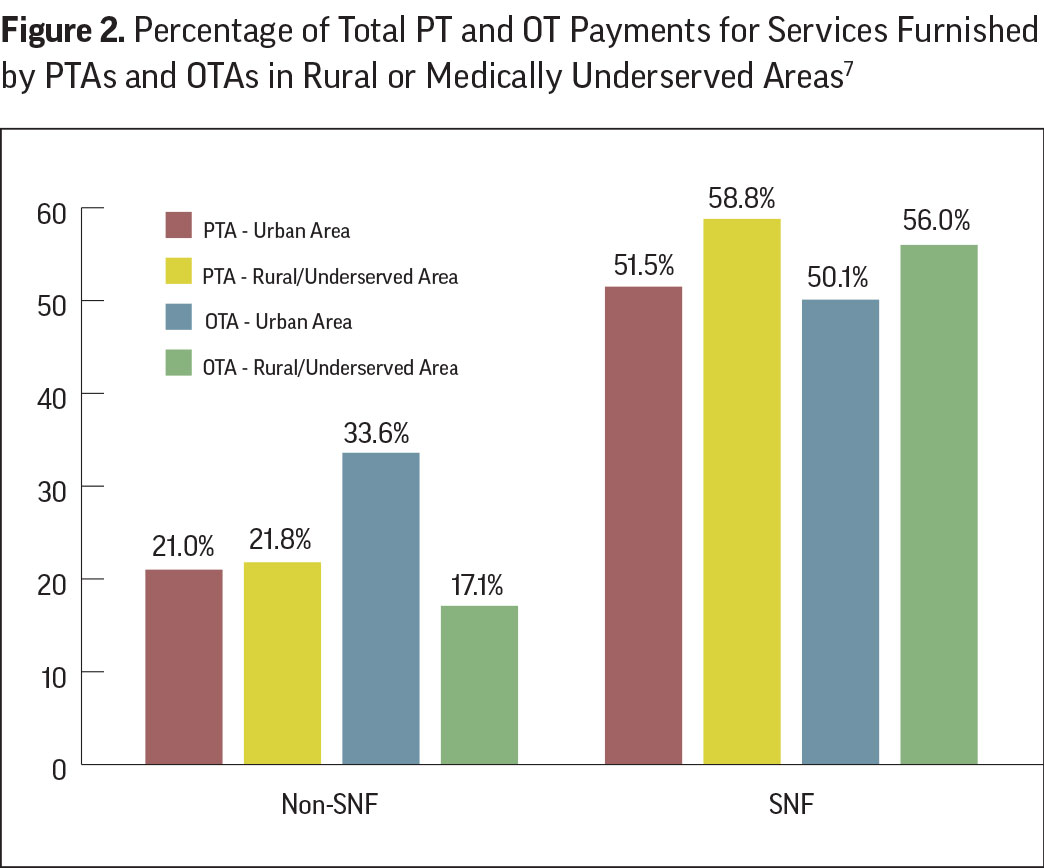 In contrast, more than half of Part B PT and OT services in SNF are furnished by PTAs or OTAs, and the relative amount is higher in rural/underserved areas. Specifically, while PTA use in urban areas was 51.5 percent of SNF PT payments, this increased to 58.8 percent in rural/underserved locations. Similarly, OTA represented 50.1 percent of SNF OT payments in urban locations and increased to 56 percent of total OT payments in rural/underserved locations.
Implications on Beneficiary Care
The Medicare Part B therapy utilization data presented by Dobson DaVanzo and highlighted in this article reveal three important findings of significance that potentially impact beneficiary access to care from SNF providers.
First, a significant portion of Medicare beneficiaries (37 percent) live in rural or medically underserved areas where access to care has been historically limited.
Second, because SNF PTA services represents 46.3 percent of Part B PTA payments, and SNF OTA represents 85.2 percent of OTA payments across all settings, SNF providers bear a disproportionate negative impact of the recently imposed 15 percent PTA/OTA payment adjustment.
Third, because SNF providers in rural/underserved locations need to use PTA/OTA services approximately 6 percent more often than urban SNFs, these providers also bear a disproportionately larger negative impact of the recently imposed 15 percent PTA/OTA payment adjustment than non-SNF providers.
Outlook

Given the current therapy workforce shortages and difficulty in recruiting therapy personnel into rural and medically underserved locations, the recently imposed payment reductions that target PTA and OTA services could significantly reduce beneficiary access to care where access is already limited. AHCA anticipates that, when the 2022 claims data is available, it will reveal the harmful impacts of the recently implemented Part B PTA/OTA payment reductions, particularly in those rural/underserved locations at most risk. In the last Congress, the Stabilizing Medicare Access to Rehabilitation and Therapy Act (H.R. 5536) was aimed at mitigating the impact of the 15 percent PTA/OTA payment reduction, including an option for providing an exemption for rural and medically underserved areas.8 Efforts by AHCA/NCAL and our therapy coalition partners are already underway to reintroduce similar legislation in the upcoming year.
Daniel Ciolek is associate vice president, therapy advocacy, for the American Health Care Association.
References
1. Pub. L. 115–123, February 9, 2018. https://www.congress.gov/115/plaws/publ123/PLAW-115publ123.pdf
2. CMS Therapy Services webpage at https://www.cms.gov/medicare/billing/therapyservices.
3. Final Report: Impact on Medicare Spending of the Stabilizing Medicare Access to Rehabilitation and Therapy Act – Appendix – Detailed Data. August 18, 2022. Dobson DaVanzo & Associates, LLC.
4. Coalition members: American Physical Therapy Association (APTA), American Health Care Association (AHCA), American Occupational Therapy Association (AOTA), Alliance for Physical Therapy Quality and Innovation (APTQI), National Association of Rehabilitation Providers and Agencies (NARA), National Association for the Support of Long Term Care (NASL), and Private Practice Section of the American Physical Therapy Association (PPS)
5. Derived from Exhibit 1 in Final Report: Impact on Medicare Spending of the Stabilizing Medicare Access to Rehabilitation Act – Appendix – Detailed Data. August 18, 2022. Dobson DaVanzo & Associates, LLC.
6. Derived from Exhibit A-4 in Final Report: Impact on Medicare Spending of the Stabilizing Medicare Access to Rehabilitation Act – Appendix – Detailed Data. August 18, 2022. Dobson DaVanzo & Associates, LLC.
7. Derived from Exhibit A-7 in Final Report: Impact on Medicare Spending of the Stabilizing Medicare Access to Rehabilitation Act – Appendix – Detailed Data. August 18, 2022. Dobson DaVanzo & Associates, LLC.
8. Stabilizing Medicare Access to Rehabilitation and Therapy Act (H.R. 5536) https://www.congress.gov/bill/117th-congress/house-bill/5536/all-info