People are creating new data at an incredible rate. With smart phones, digital sensors, and social media, they are creating an estimated 2.5 quintillion bytes of new data every day worldwide. This so-called Big Data is enough data to fill 10 million DVDs that, when stacked, would reach twice as high as the new One World Trade Center tower in New York City. It’s been said that harnessing data for analytical value is the key to better health, higher-performing companies, and an improved understanding of the planet.
On the Home Front
In long term/post-acute care (LT/PAC), the ability to collect and analyze information is at the core of new payment models and quality measurement. Despite that, most organizations continue to struggle at getting meaningful return on investment from their data analytics initiatives. Analytics important to LT/PAC focus on areas such as revenue cycle; cost; census; marketing; quality programs (such as QAPI); readmission rates; and other clinical, financial, or operational domains.
In fact, one study points out that of the 97 percent of companies using analytics, only one-fifth are happy with the results. Another study from Quest Diagnostics and Inovalon shows that 65 percent of health care providers do not have the capability to utilize all the patient data they have available. There are more data and analytics technologies available today than ever before, and yet organizations still struggle to deploy meaningful analytics. So, what can be done?
Start an Analytics Initiative
Here are seven ways to start or improve analytics initiatives to help providers more effectively use information for decision making.
1. Understand the requirements. The last thing an information technology (IT) specialist wants to do is take an “if you build it, they will come” approach. There are many instances where countless hours have been spent developing beautiful dashboards and visualizations only to have them never get used. To ensure the care center’s analytics are relevant and meaningful, start with the people who actually use the information. Seek to understand what questions they have that analytics can answer.
Determine what key performance indicators, or reports, are needed, how often they are used and for what purpose, what the indicators are of good or bad performance, and what actions are taken to understand root causes.
Analytics are not only for the executives, so consider needs across the organization. Develop personas that define roles and patterns of information consumption. Understand differences in how people want to experience analytics. The chief financial officer (CFO) and chief executive officer (CEO) may be looking for dashboards that provide a snapshot across clinical, operational, and financial areas to understand organizational performance at a glance. Facility administrators and clinicians may not be chained to a desk and require information delivered in near real-time on their device of choice, especially when resident care is involved.
Financial analysts may require access to a deep data set with sophisticated tools to analyze trends or answer questions. These individuals may require access to information via web-based dashboards, mobile devices, proactive e-mails, or even Microsoft Excel depending on their role. When it comes to information delivery, one size does not fit all. Test and validate these with focus groups to ensure it is right.
2. Understand the company’s information assets. Once the IT specialist knows what questions need answers, determine what information assets are available to provide them. Take inventory of the clinical, operational, and financial applications available and what role they will play. Understand what data may be available from third parties. Determine whether big data sources are required or could help provide even more context.
3. Think in terms of domains. It is helpful to build up the organization’s library of analytics by thinking and working in domains. Focus on specific areas such as staffing, financials, marketing, quality measures, or readmission rates. Continue to define and build out each domain with an attitude that “done beats perfect.” Use rapid prototyping techniques, which describe an iterative approach to mocking up what a dashboard or report may look like and reviewing these mock-ups with users before the final product is created. This saves time and helps ensure the information produced is relevant and understandable for the user.
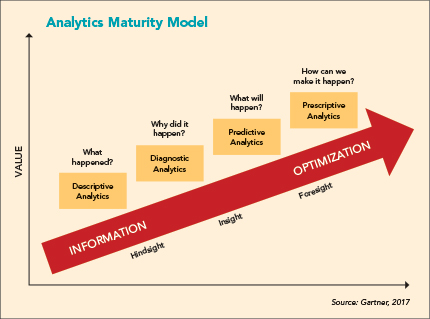
4. Scale up to analytics maturity. Analytics maturity typically starts with focusing on understanding what has happened, with progression toward what may happen. What has happened provides a historical snapshot of past performance, along with insights into root cause. What will happen focuses on leveraging advanced analytics to attempt to foreshadow possible outcomes and even recommend actions to take.
For instance, dashboards and reports can provide a historical view of the residents who fell in the past 60 days. More advanced technologies such as machine learning can uncover the attributes of people who fell and predict who may be at a higher risk for falling in the future. This can help clinicians and LT/PAC professionals work to prevent falls from occurring in the first place.
The Analytics Maturity Model, right, provides a useful road map framework for evolving an analytics strategy. Start with descriptive and diagnostic analytics to create a data and cultural foundation to build on. Identify cases where predictive or prescriptive analytics may be useful down the road.
5. Address capability constraints. Analytics is never done. Economic changes, regulatory changes, changing business conditions, and changes in population health all contribute to an ever-evolving operating environment. These will drive changes in the center’s information needs and will bring forth new questions that need to be answered. To address this, be prepared to continually curate analytics to derive value.
Successful organizations have a strategic vision for analytics that is driven from the top. Often these organizations employ a competency center team or person to champion usage, implement governance and best practices, and continuously curate. They also focus on a data-driven culture where using analytics is everyone’s responsibility.
And as the center moves up the Analytics Maturity Curve, consider the skills and tools currently available and adjust where needed. For instance, predictive analytics may require new technology for processing big data, or people such as data scientists who understand statistical algorithms and how to leverage them and interpret results.
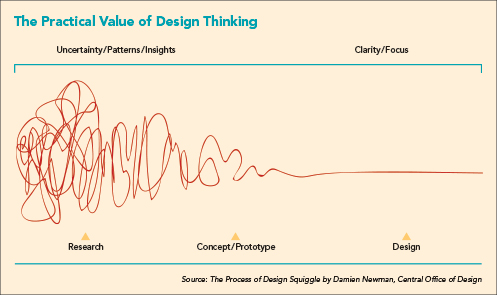
6. Use proper visualizations. Design thinking techniques start with research aimed at defining patterns and common attributes. Interviewing typical users such as the CEO, CFO, facility administrators, directors of nursing, marketing, nutrition, and others to understand and document a typical day-in-the-life, along with rapid prototyping, can help move the process along from uncertainty to clarity. The picture on the next page shows a typical design thinking pattern, starting with research and prototyping and evolving to design and, eventually, innovation.
According to Katarina Djakovic from Inchoo, a full service e-commerce design agency, the takeaway when thinking about design is to analyze, understand, ideate, prototype, test, and test often to minimize the uncertainty and risk of innovation. Design thinking relies on individual insights gained from real-world experiments, not just historical data or market research.
These design thinking concepts play a key role in producing dashboards and reports that users within LT/PAC organizations interact with. Visualizations, dashboards, and reports must tell a story that is relevant to the user. Use text along with charts and tables. Avoid too many pie charts, and use these sparingly.
Use color judiciously and with a purpose to highlight areas or information the user should pay special attention to. Design dashboards to answer particular questions, or provide insight for specific roles.
Consider rolling out governed discovery, self-service, and mobile capabilities to empower users to slice-and-dice their data from any device anywhere to allow them to answer their own questions and keep them highly engaged.
7. Build trust. No matter how informative reports and dashboards appear, people will not use them if they don’t trust the data. Dashboards and reports are used to make important decisions, and it’s important to not base those on the wrong information. As IT specialists develop dashboards and reports, they must ensure the data are accurate and tie out to supporting systems, and that any differences are documented and easily explained.
Pilot analytics usage with a small group of users before rolling it out to the masses. This is a way to validate the solution and data integrity and offers the chance to make course corrections before everyone gets their hands on it.
Internally market the analytics rollout to build momentum and anticipation. And regularly follow up with users to ensure they are receiving value.
On or Off the Shelf
If an off-the-shelf analytics solution is purchased from a clinical software vendor, make sure it is flexible enough to tailor it to the center’s unique requirements. And if instead the center builds its own analytics, be careful. Often clinical software applications are designed for clinical workflows and not for custom analytics. If going this route, it’s a must to develop deep knowledge of the underlying application data model and business rules to build it correctly.
It’s important to put in place a governance process to address the impact to the center’s analytics when the underlying application changes. In these cases, it may be best to consider starting with a vendor solution that can be extended rather than starting from scratch.
The ultimate secret to success in anything is to get started. Think big, start small, and adjust quickly, and the organization will be well on its way to harnessing the power of analytics for data-driven decision making.
Lee Kilmer is vice president of product management for MatrixCare, which released its next-gen analytics suite in June. He can be reached at lee.kilmer@matrixcare.com.